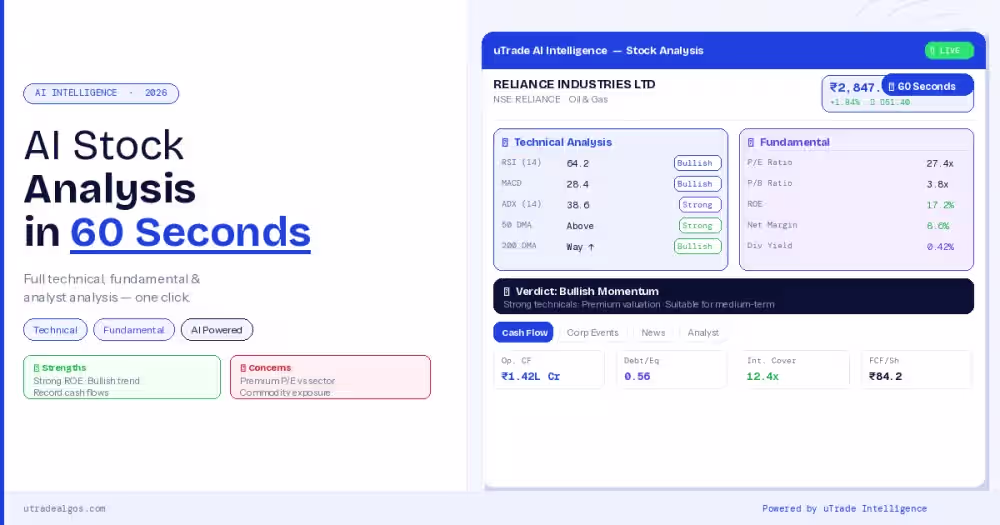
What Are Graphical Representation Tools in Algo Trading?
Graphical representation tools of payoff charts in algorithmic trading refer to software applications, platforms, or features that allow traders and investors to visualise and analyse market data, trading strategies, and portfolio performance through interactive charts, graphs, and dashboards. These tools enable users to monitor real-time market movements, identify trading opportunities, assess risk, and optimise trading strategies more effectively.
Importance of Graphical Representation Tools in Algo Trading
- Visualising Complex Data: It simplifies the processing of vast data in algo trading, converting it into intuitive visual formats like line charts and heat maps. This allows traders to quickly grasp market trends, patterns, and anomalies, enhancing their analytical capabilities and decision-making.
- Analysing Trading Strategies: It enables traders to visually track and assess the performance of their algorithmic strategies, identifying areas for optimisation.
- Monitoring Portfolio Performance: It provides real-time interactive dashboards for monitoring portfolio allocation, assessing individual asset performance, and managing risk.
- Enhancing Decision-Making: It empowers traders with actionable insights, visual alerts, and customisable notifications based on trading rules and performance metrics.
USPs of uTrade Algos’ Graphical Representation Tools
User-Friendly Interface
One of the standout features of uTrade Algos' algo trading platform is the graphical representation of option payoff charts tools and their user-friendly interface. Designed with traders and investors in mind, the platform offers intuitive navigation, customisable dashboards, and interactive charts that make it easy for users to visualise complex data and identify trading opportunities effortlessly.
Advanced Charting Capabilities
The graphical representation tools of payoff charts in algorithmic trading come equipped with advanced charting capabilities that allow users to create, customise, and analyse a wide range of charts. The platform also offers a variety of technical indicators, drawing tools, and analytical features to help users perform in-depth market analysis and make data-driven trading decisions.
Real-Time Data Visualisation
In today's fast-paced trading environment, having access to real-time data is crucial for staying ahead of the curve. uTrade Algos' graphical representation tools provide real-time data visualisation capabilities, allowing users to monitor market movements, track portfolio performance, and execute trades with precision and confidence.
Customisable Templates and Layouts
Every trader and investor has unique needs and preferences when it comes to data visualisation. That's why the platform offers customisable templates and layouts that allow users to create personalised dashboards and charts tailored to their specific requirements, ensuring a seamless and personalised trading experience.
Integrated Risk Management Tools
Risk management is a critical aspect of successful trading, and the platform’s graphical representation tools excel in this area by offering integrated risk management tools that help users identify, assess, and mitigate potential risks effectively. From stop-loss to risk-reward ratio calculators, the platform provides all the essential tools traders need to manage risk proactively.
Seamless Integration with Algorithmic Trading Strategies
Its graphical representation tools are seamlessly integrated with its algorithmic trading platform, allowing users to visualise the performance of their automated trading strategies in real-time. This integration enables traders to monitor strategy performance, adjust parameters, and optimise algorithms directly within the graphical interface, streamlining the algo trading process and enhancing overall efficiency.
Caution When Using Graphical Tools in Algo Trading
- Over-Reliance on Visuals: On algo trading platforms, avoid relying solely on graphical representations without considering underlying data or algorithmic logic.
- Misinterpretation of Data: Be cautious of misinterpreting visual patterns or trends, leading to incorrect trading decisions.
- Data Lag or Latency Issues: Ensure real-time data updates to prevent trading based on outdated or delayed information.
- False Sense of Security: Be aware that visually appealing charts can sometimes give a false sense of security, leading to increased risk-taking without proper analysis.
- Lack of Customisation’ Ensure graphical tools allow sufficient customisation to suit individual trading strategies, preferences, and risk tolerance.
- Inadequate Risk Management Features: Ensure graphical tools integrate robust risk management features to monitor and control trading risks effectively.
- Limited Scalability: Choose tools that can scale with growing data volumes and complexity to maintain performance and reliability over time.
In conclusion, it can, indeed, be said that uTrade Algos' graphical representation tools, by offering a comprehensive suite of features and functionalities designed to meet the diverse needs of traders and investors, has established itself as a go-to platform for those looking to leverage the power of graphical representation of option payoff graphs in their trading endeavours. Whether you're a novice trader or a seasoned investor, this platform’s graphical representation tools provide the tools, insights, and support you need to succeed in today's dynamic and competitive financial markets.