Technical analysis is a powerful tool used by traders to predict future price movements based on historical market data. One of the fundamental aspects of technical analysis is the use of chart patterns. These patterns, which form on stock charts due to the price movements of securities, are key indicators that traders rely on to make informed trading decisions. In this blog, we will explore the role of chart patterns in technical analysis and how they can be utilised effectively for trading.

Options trading is a realm replete with potential rewards, offering traders various strategies to capitalise on market movements. However, the complexity inherent in options demands a cautious approach. Unlike other financial instruments, options carry specific nuances such as strike prices, expiration dates, and diverse option types. Navigating this intricate market necessitates a deep comprehension of these aspects, as miscalculations can lead to significant losses. Here are seven common pitfalls to evade for successful call and put option trading.

In algorithmic trading, the importance of risk management cannot be overstated. Algo strategies, while offering speed and precision, are inherently intertwined with risks. Understanding and effectively managing these risks is paramount as it determines the success or failure of such strategies. Here, we explore the pivotal role of risk management in shaping the fate of algo trading strategies.

In trading, the validation and optimisation of strategies are pivotal for success. Backtesting, the process of testing a trading strategy using historical data, is a crucial step in this journey. While both algorithmic and manual testing methods have their merits, algo backtesting holds several advantages over manual testing. Let's find out the specific benefits of utilising algorithmic backtesting for refining trading strategies.
Algorithmic trading introduces potential risks due to automated processes, magnifying market exposure. Regularly evaluating your algo trading strategies becomes pivotal to mitigate risks and maintain performance standards amidst market volatility. Active tracking allows for identifying and rectifying minor discrepancies before they escalate into significant losses, aligning strategies with prevailing market trends. But how can you effectively evaluate algo trading strategies? By employing performance metrics. Let us find out more.

In the world of finance, achieving a diversified investment portfolio is a well-acknowledged strategy for minimising risk and enhancing potential returns. Over time, the emergence of algorithmic trading has significantly transformed the landscape of portfolio diversification. Let us find out about the critical role played by algorithmic trading in effectively diversifying investment portfolios, exploring its benefits, strategies, and considerations.

In financial markets, two primary methods of trading stand out: algorithmic trading and manual trading. Each approach has its set of advantages and disadvantages, appealing to different types of traders based on their preferences, expertise, and goals. Read on to know more about the pros and cons of both algorithmic trading software and manual trading, allowing traders to make informed decisions about which method aligns best with their objectives.
Interested in trading? Chances are you've encountered the terms quantitative trading and algorithmic trading. But what exactly do they involve, and how do they differ? Let's find out more.
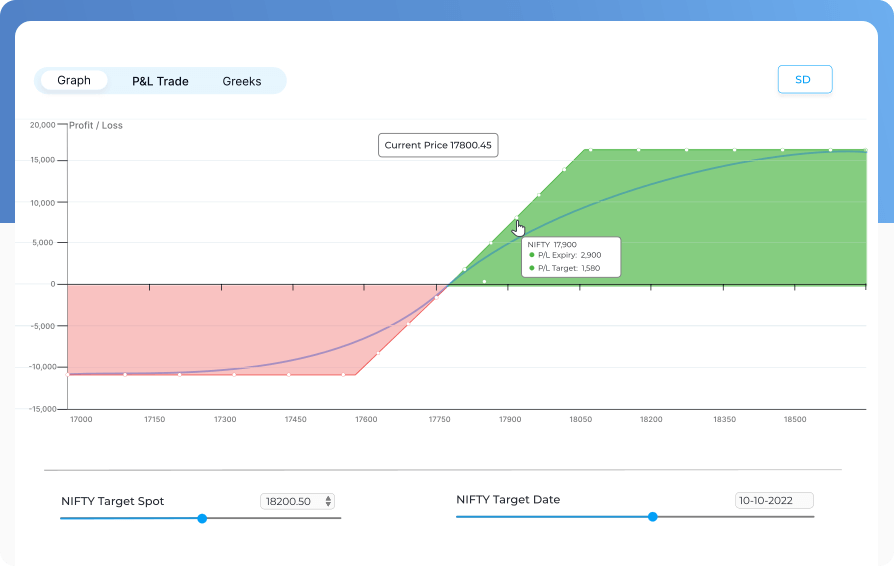
In algorithmic trading, the visual representation offered by payoff graphs plays a pivotal role in guiding decision-making processes. These graphs present a clear picture of potential profit and loss scenarios based on various trade strategies and market conditions. Let's explore how payoff graphs aid decision-making in algorithmic trading.
Algorithmic trading has revolutionised financial markets, employing sophisticated strategies to execute trades automatically. Central to this are two fundamental concepts: underlying and instrument. While often used interchangeably, these terms encapsulate distinct elements crucial for traders and investors navigating the complexities of automated algo trading. Read on to find out what the seven key differences between underlying and instrument are.